Viewing 1 post (of 1 total)
Viewing 1 post (of 1 total)
- You must be logged in to reply to this topic.
Home › Jitsutech University › Tuesday Technology › How do I Generate Data Visualizations from My Data Set?
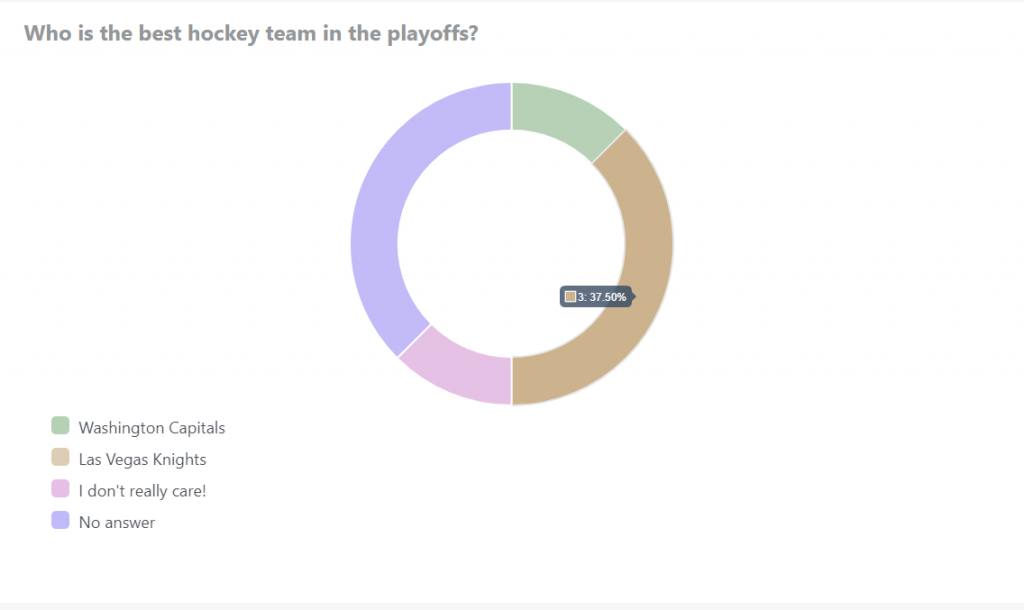
FactFinder has the ability to generate data visualization from the data set.
We have a significant question bank that is listed as Ratio, Interval, Nominal and Ordinal. Each of questions has been specialized with a specific Quantitative Report, so you do not have to do any of the work.
Simply, click the report button and start analyzing the data set. Also, you can download the data set in .PDF, .CSV and .SPSS formats for further analysis in software such as Microsoft Excel 2016 or SPSS.
